
If you need to run a year-to-date (totals) report, follow these steps:
- On the left, in your Mission Control, click Timesheets.
- On the right, select either View program-wide data or View site data.
-
On the next page, choose the relevant Timesheet Template.
-
At the bottom of the page, select Build Custom Reports.

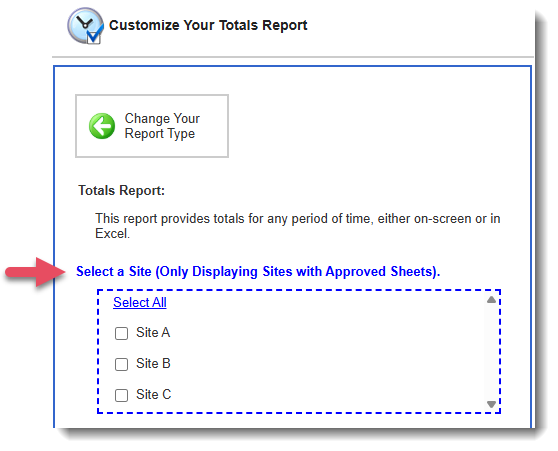
- On the next page, choose Totals Report.
-
If you selected View site data in step 2, you’ll be prompted to choose the site or sites you’re assigned to. If you selected View program-wide data in step 2, this step will be skipped.
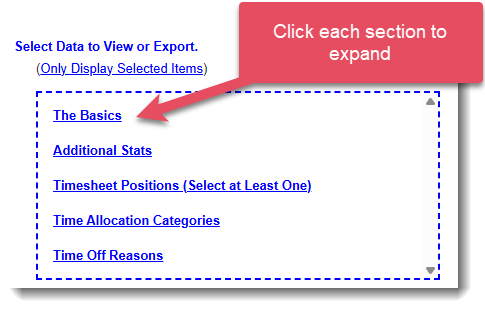
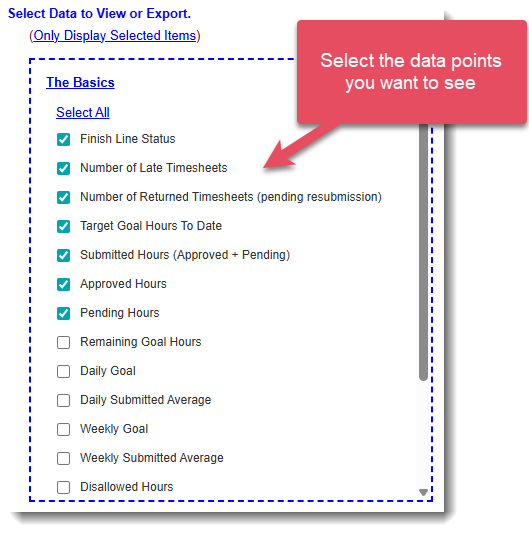
- On the next page, Select Data to Export. You can choose as many data points as you’d like.
- Under Select Site Breakout Options, choose what site data (if any) you would like to include.

Your options are:- Do not include site names - No column will display site-level data.
- Include site names (no breakouts) - All data for each reporter appears in a single row, with each site separated by “;;”. Use this option when you want to see where the reporter served each day, without tying specific hours to specific sites.
- Include site names (breakouts). - A separate row is created for each site where a reporter served. Use this option when you need to see the exact hours the reporter recorded at each individual site.
- Under Select One or More Reporters, choose which reporters you’d like to include.

Your options are:- Include all relevant reporters.
- Select specific reporters.
- Include all relevant reporters.
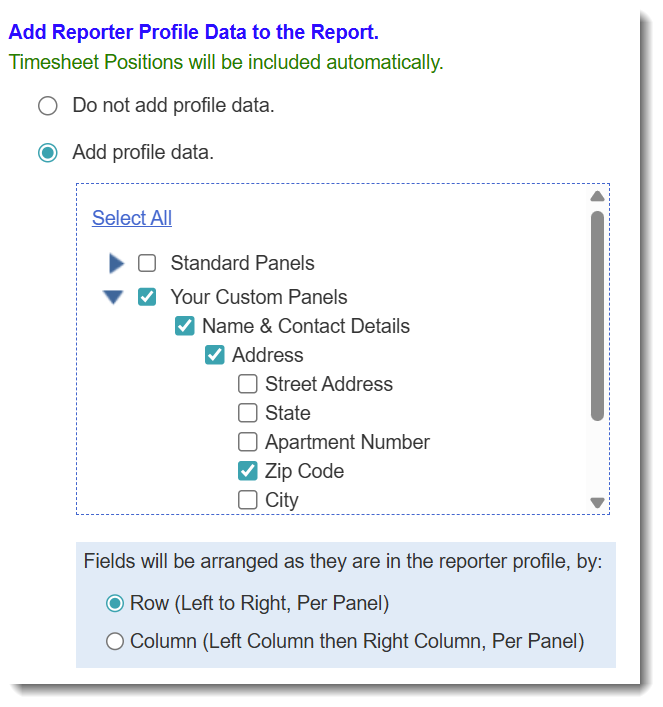
- Under Add Reporter Profile Data to the Report, select any reporter profile fields you’d like to include.

Your options are:- Do not add profile data.
- Add profile data. - Choose any number of Standard or Custom fields to include.
- Use the Select a Time Period section to select the time period that the report should include.
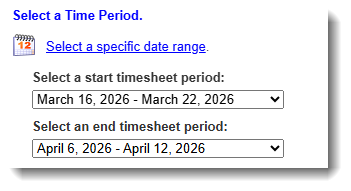
NOTE: Each date range in the drop-down menu (e.g., May 6, 2026 – April 12, 2026) represents a single timesheet period.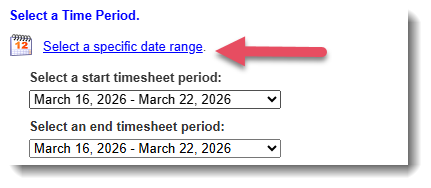
TIP: You can click Select a specific date range to enter exact dates instead of using timesheet periods. - Choose whether to Include audit trail timestamps. When selected, your report will include the status, date, and timestamp for: (1) The most recent time each reporter submitted the relevant timesheet, and (2) The most recent time a supervisor or program staff member approved or partially approved that timesheet.
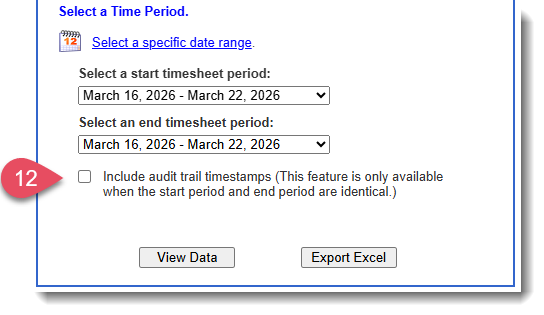
- Choose your report format by clicking View Data in an on-screen report or Export Excel.

CAUTION: Some data points in the Totals report are always year-to-date, even when a specific date range was picked. These year-to-date stats include:
-
Finish Line Status
- Target Goal Hours To Date
-
Remaining Goal Hours
-
Daily Goal
-
Daily Submitted Average
-
Weekly Goal
-
Weekly Submitted Average
- Number of Launched Timesheets (total due before today)
- Number of Submitted Timesheets
- First Date with Hours
- Most Recent Date with Hours
- Has this Member met the Goal Hours?