Skip to content
English
  • There are no suggestions because the search field is empty.

Understanding Excel Formatting For Survey Data Exports

Learn How Survey Data Export Tabs Are Organized In Excel


Export Options That Affect Workbook Tabs

The tabs in your Excel workbook depend on the report type and worksheet options you select before exporting.

Available worksheet options may include:

  • Grand Totals
  • Grand Totals Transposed
  • Detailed Totals
  • Detailed Totals Transposed
  • Data Grouped by Question
  • Totals by Question
  • Data Grouped by Launch
  • Totals by Launch
  • Matrix True View
  • Raw Data

Some options appear only for certain export types, such as Program-Wide Data, Site Data, View Association Data, or Member-by-Member Export.


The Legend Tab

Most downloaded workbooks include a Legend tab.

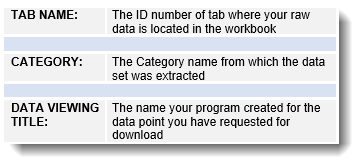
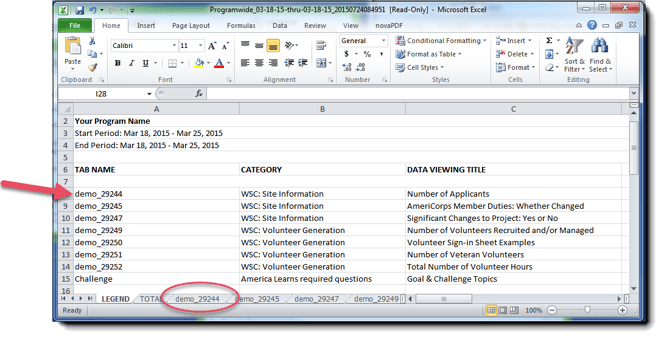
Use the Legend tab to identify what each worksheet contains. This is especially helpful when your workbook includes multiple questions, launches, sites, associations, or raw data tabs.

The Legend tab may help you identify:

  • The worksheet name
  • The related question or data point
  • The question ID
  • The export format used for each tab

NOTE: If you exported only summary totals, you may not need to use the Legend tab.


The Grand Totals Tab

The Grand Totals worksheet summarizes the data included in the export.

Use this tab when you need a high-level view of results across the selected date range and selected records.

Depending on the export type, this option may appear as:

  • Grand Totals
  • Grand Totals (Sites are Rows)
  • Grand Totals Transposed (Sites are Columns)

When the worksheet is transposed, the same totals are shown in a different layout. For example, sites may appear as columns instead of rows.


The Detailed Totals Tab

The Detailed Totals worksheet provides a more detailed summary than the Grand Totals worksheet.

Use this tab when you need totals broken out by selected records, attributes, questions, or other available groupings.

Depending on the export type, this option may appear as:

  • Detailed Totals
  • Detailed Totals (Sites are Rows)
  • Detailed Totals Transposed (Sites are Columns)

NOTE: The available detailed total layouts depend on the export type you selected.


The TOTAL Tab

Some formatted exports include a TOTAL tab.

The TOTAL tab contains summary totals for the survey data included in the workbook. This tab is commonly included when you select a totals-based formatted worksheet.

Use the TOTAL tab when you need summarized results instead of response-level detail.


The TOTAL_ATTRIBUTES Tab

Some formatted exports include a TOTAL_ATTRIBUTES tab.

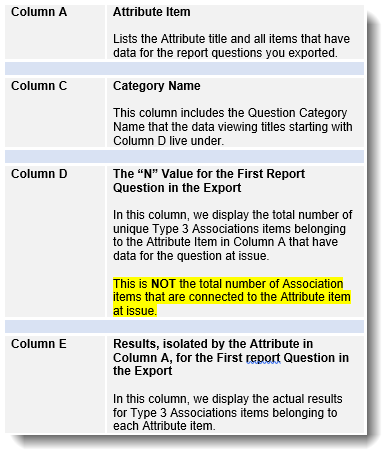
The TOTAL_ATTRIBUTES tab organizes totals by selected data points or attributes. The same group of columns may repeat based on the number of data points included in the export.

Use this tab when you need to compare totals across selected attributes.


Data Grouped By Question Or Totals By Question

The Data Grouped by Question or Totals by Question option organizes exported data around each question.

Depending on your export, the workbook may include:

  • A separate worksheet for each question
  • Question ID numbers in worksheet names
  • A legend that maps worksheet names to question text

Use this format when you want to review results question by question.

TIP: In Excel, you can rename a worksheet tab by double-clicking the tab name and entering a new name.


Data Grouped By Launch Or Totals By Launch

The Data Grouped by Launch or Totals by Launch option organizes exported data by launch period.

Use this format when you need to compare results across survey launches or reporting cycles.

Depending on the export, each launch may appear as:

  • A separate worksheet
  • A grouped section within a worksheet
  • A labeled row or column grouping

Matrix True View

The Matrix True View worksheet displays matrix question data in a layout that closely matches the original matrix structure.

Use this tab when you need to review matrix-style responses in a format that is easier to compare across rows and columns.

This option is most helpful for exports that include matrix questions or sub-questions.


Raw Data

The Raw Data worksheet contains response-level data.

Use this tab when you need the most detailed version of the export. Raw data is useful for filtering, sorting, pivot tables, or additional analysis outside America Learns.

In raw data worksheets:

  • Each row usually represents one response or one respondent’s data record.
  • Columns contain identifying information, question data, response values, dates, or related fields.
  • The layout may vary based on the selected export type and data included.

CAUTION: Raw data can include many columns. Use the Legend tab when you need help matching worksheet tabs or fields to the related questions.


Individual Question Tabs

When you export raw data for individual questions, the workbook may include a separate worksheet for each question.

Each worksheet contains the response-level data for that question. In these worksheets, each row usually represents one individual response to the question.

Question worksheets may use the question ID as the worksheet name. Use the Legend tab to match the worksheet name to the full question text.


Large Exports

If an export includes more questions or sub-questions than one workbook can support, America Learns may create multiple Excel files.

Each workbook may include up to 250 worksheets.

NOTE: There is no limit to the number of Excel files that may be created for a single export.


Workbook Tab Reference

Worksheet Or Option What It Contains When To Use It
Legend A guide to workbook tabs, question IDs, and related data Use this first when the workbook includes multiple tabs
Grand Totals High-level summary totals Use this for a quick overall summary
Grand Totals Transposed High-level summary totals with rows and columns switched Use this when the transposed layout is easier to read
Detailed Totals More detailed totals by available groupings Use this for deeper summary review
Detailed Totals Transposed Detailed totals with rows and columns switched Use this when sites or other records are easier to compare as columns
TOTAL Summary totals for selected data Use this for totals-based reporting
TOTAL_ATTRIBUTES Totals grouped by selected attributes or data points Use this for attribute-based comparisons
Data Grouped by Question Data organized by question Use this to review one question at a time
Totals by Question Totaled data organized by question Use this to compare question-level totals
Data Grouped by Launch Data organized by launch period Use this to compare launches or reporting cycles
Totals by Launch Totaled data organized by launch period Use this to compare launch-level totals
Matrix True View Matrix question data in a matrix-style layout Use this for matrix questions or sub-questions
Raw Data Response-level data Use this for filtering, sorting, and custom analysis
Individual question tabs Response-level data for a single question Use this when the workbook separates questions into their own tabs